Tutorial 1
Start a study from a template
- On the start page, click Start from a template (or File → New from a template).
- Choose a design such as Diet-induced obesity or CCl₄ liver fibrosis.
- On Setup, rename groups and cages, set the number of animals and the start date.
- Check the dosing schedule on Dosing, then File → Save as to keep the study in a file.
Video: coming soon
Tutorial 2
Record a weekly weigh-in
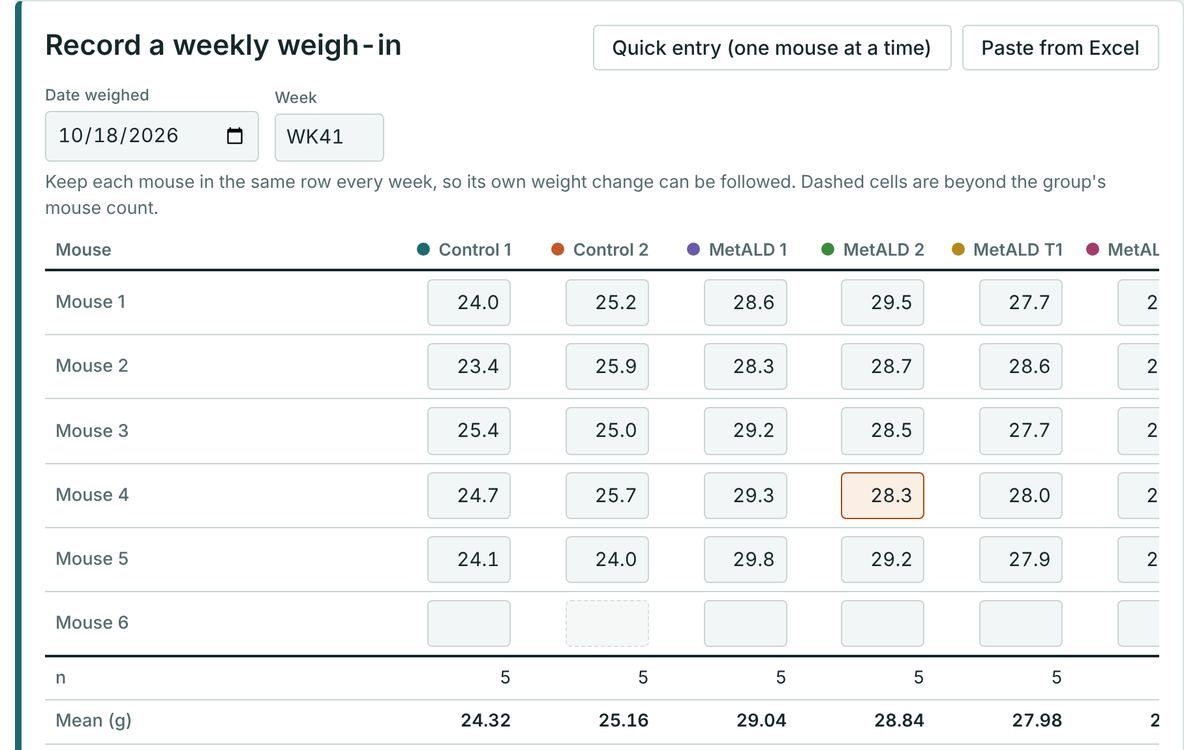
- Open Body weight; today’s date and the study week are filled in.
- Type each weight; Enter moves down, arrow keys move between cells.
- A weight 15% or more above the last weigh-in is highlighted so you can recheck it.
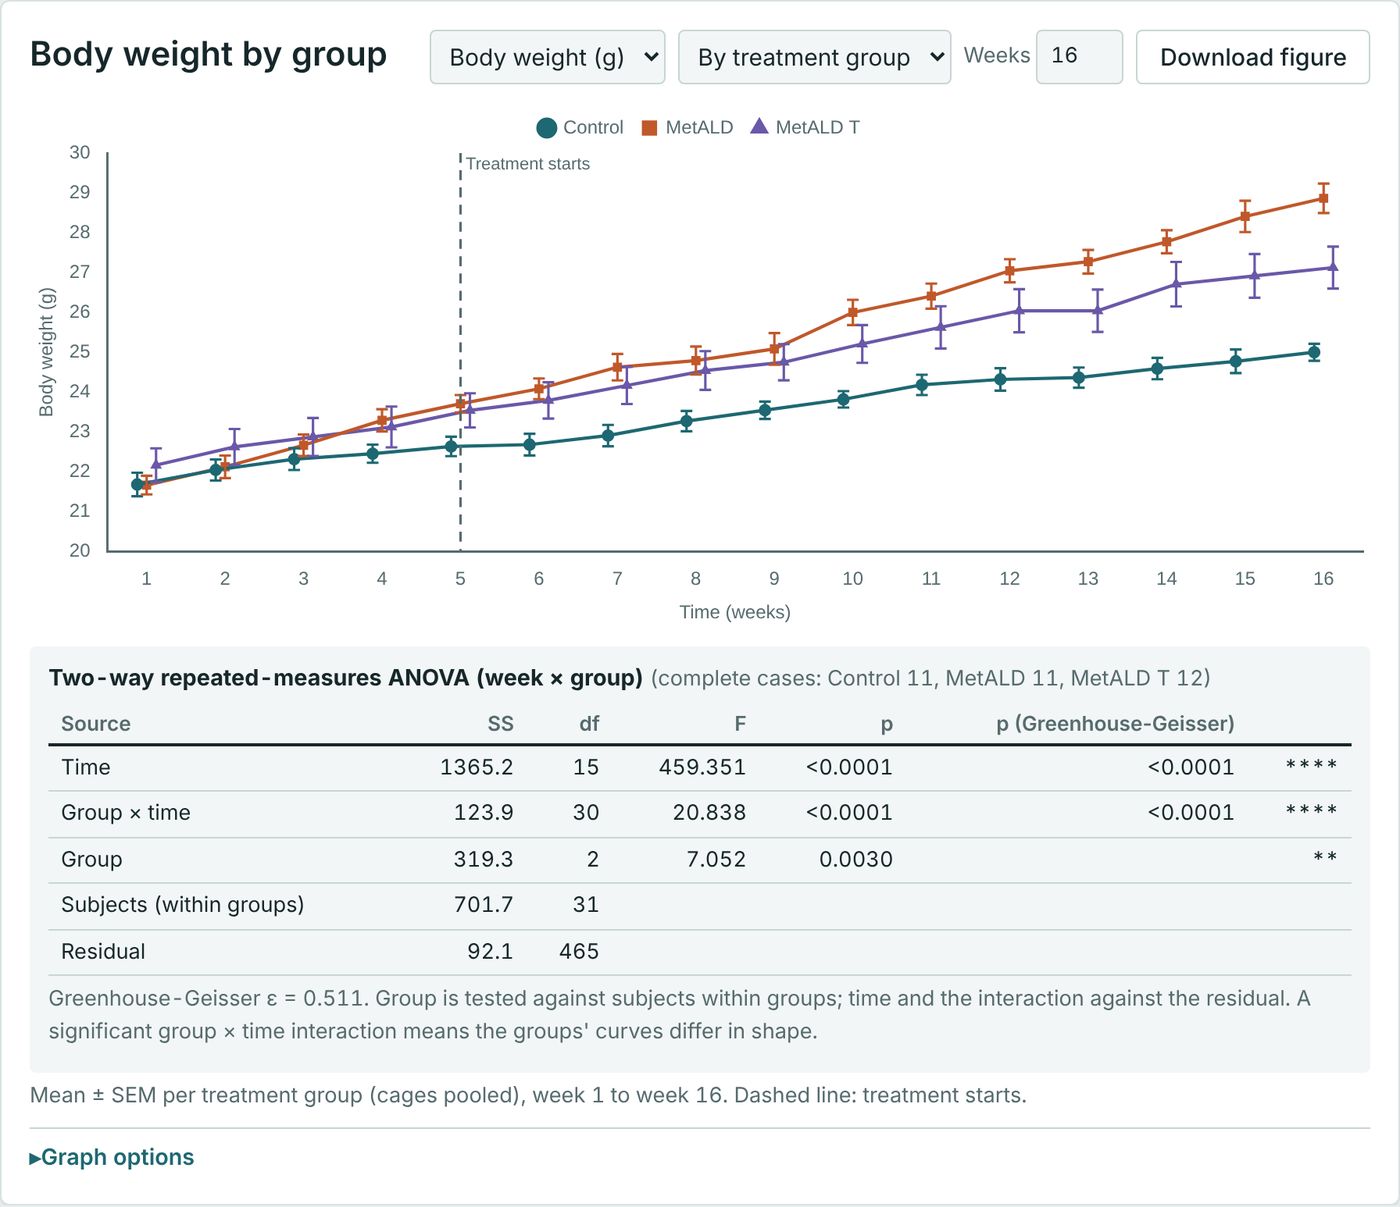
- The graph and repeated-measures ANOVA update as you type.
Video: coming soon
Tutorial 3
ELISA: import a plate and fit the curve
- In Graph Studio choose + New table → ELISA.
- Click Import 96-well plate and either paste the 8 × 12 grid or Load plate-reader file….
- Pick a layout preset (standards in columns 1–2, samples in duplicate) or type your own labels.
- Accept the suggested model and weighting, then read concentrations, with dilution factors applied.
Video: coming soon

Tutorial 4
Paste participants and randomise
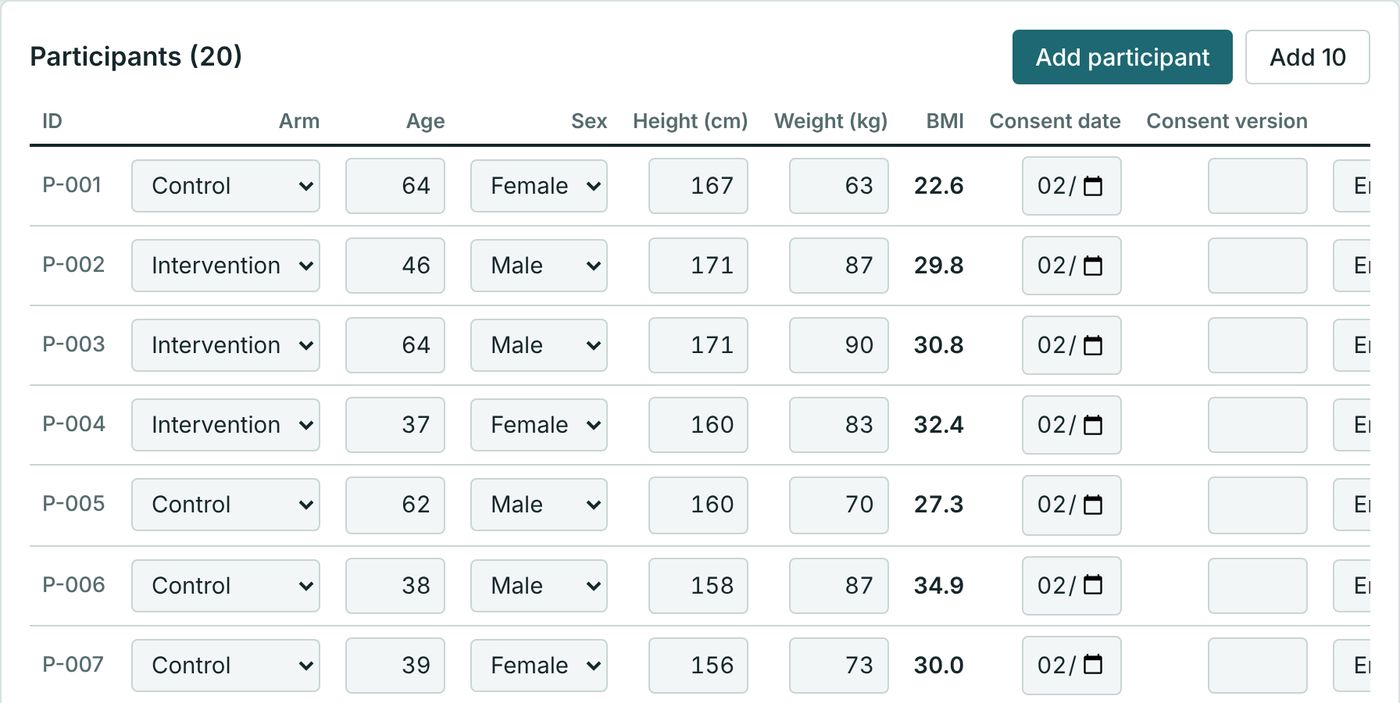
- In Clinical study → Participants, click Paste from Excel.
- Paste rows with ID, Arm, Age, Sex, Height, Weight, Consent date; a header row is matched by name.
- Set Planned n for each arm under Study & arms to track recruitment.
- Use Randomisation for concealed block allocation with an allocation log.
Video: coming soon
Tutorial 5
Export a report
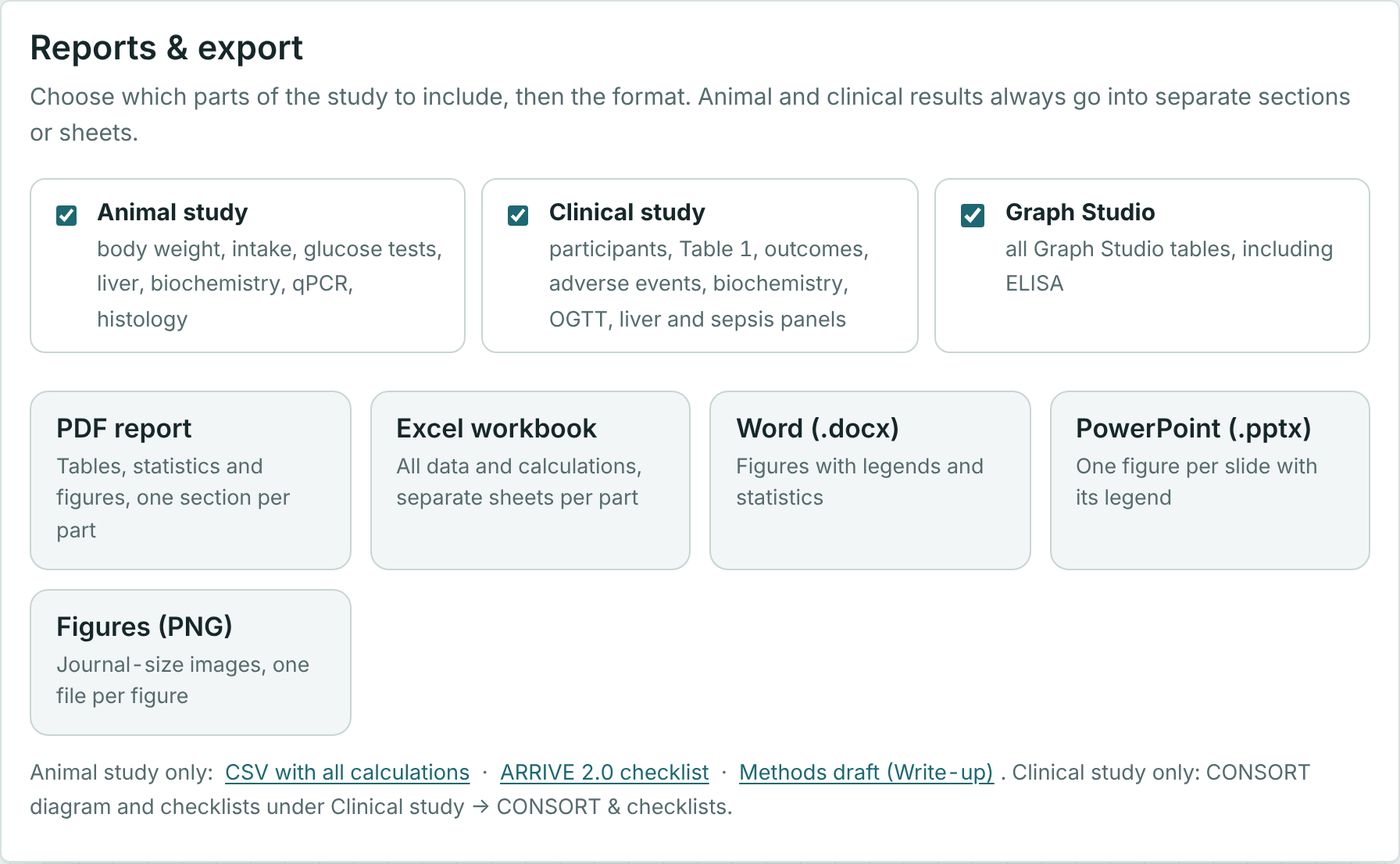
- Open Reports & export.
- Tick the parts to include: Animal study, Clinical study, Graph Studio.
- Choose PDF report, Excel, Word, PowerPoint or PNG figures.
- Each part gets its own sections or sheets, so results are never mixed.
Video: coming soon
Tutorial 6
Add a behaviour test
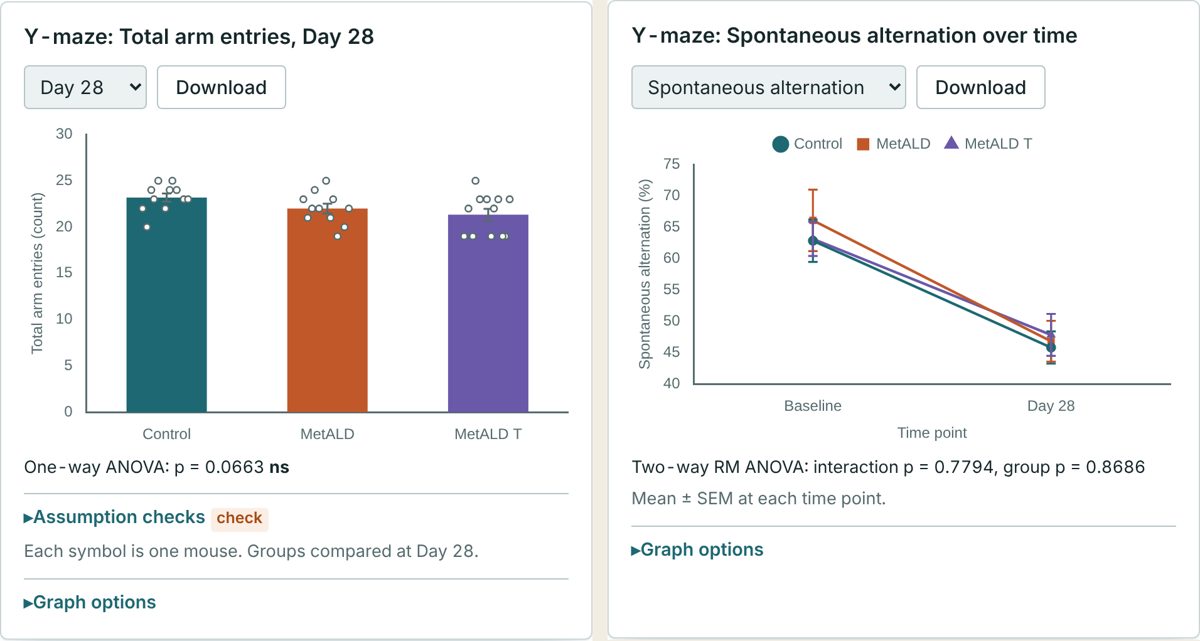
- Open Behaviour tests, choose a test (Y-maze, elevated plus maze, beam walk, rotarod…) and click Add test.
- Type the values for each animal at Baseline; derived measures such as % alternation are calculated for you.
- Add a time point (for example Day 28) and enter the values again.
- Compare groups at any time point, follow them over time, or test the change from baseline within each group.
Video: coming soon
Tutorial 7
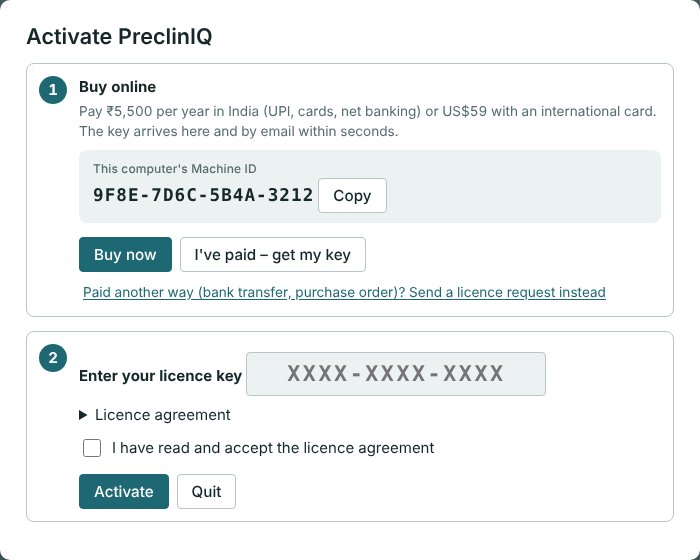
Buy and activate
- Install PreclinIQ for Windows or Mac and open it.
- In the Activate window click Buy now: the payment page opens with this computer’s Machine ID filled in.
- Pay in ₹ (UPI, cards, net banking) or US$ (international cards).
- Back in PreclinIQ the key fills in by itself and the program activates; the key is also emailed to you.
Video: coming soon